EPO Patent Applications – Trends and Highlights from 2020
Catherine Hanratty

The European Patent Office – Patent Index 2020, was published in March 2021. The data provides a snapshot of applications received and grants at the EPO during 2020. Applications are normally published 18 months from the priority date, therefore this dataset provides an early indication of trends and new developments in comparison with previous years. The application data is based on EP direct filings, and International PCT applications entered into the European regional phase at the EPO in 2020.
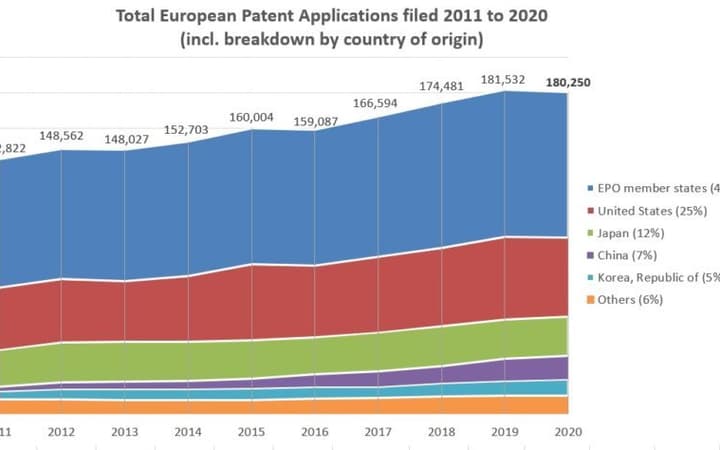
In total 180,250 patent applications were filed in 2020 at the EPO. The EPO reported a small decline (<1%) in the total number of applications filed in comparison with 2019 (181,532). 45% (81, 443) of European Patent applications in 2020 originated from Europe, 25% originated from the US, 12% from Japan, and 7% originated from China (an increase of +9.9% with respect to 2019).
FILING ROUTES: EURO-PCT vs EP DIRECT
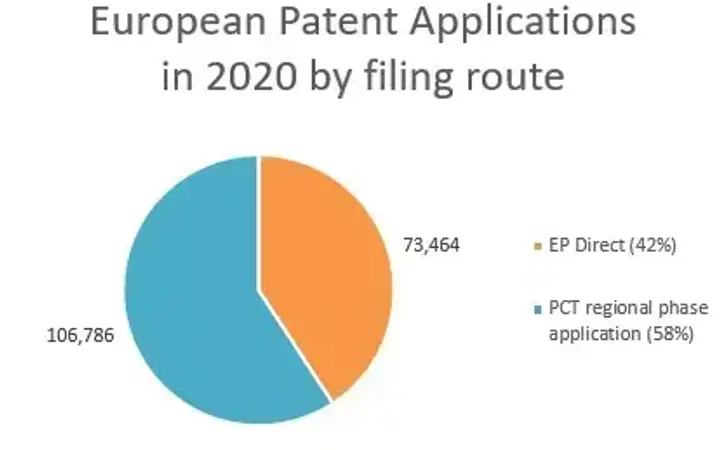
In 2020, 42% of European applications were EP direct filings, the remaining 58% were based on PCT international applications that were entered into the European regional phase during 2020.
For reference, the EPO 2004 Annual Report indicates that in that year 47% of European Applications were direct filings and 53% Euro PCT applications.
The proportion of Euro-PCTs has consistently been in the range of between 56% to 61%, over the last 10 years.
TOP FIELDS OF TECHNOLOGY BY APPLICATIONS RECEIVED
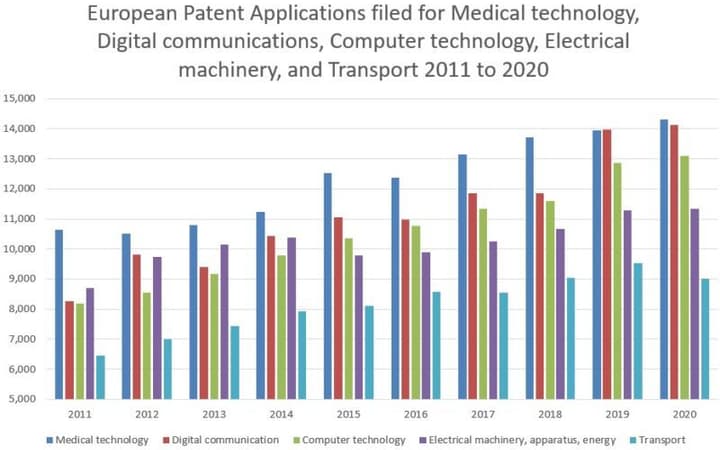
Medical technology was the number 1 field of technology in 2020 in terms of patent applications filed at the EPO, as it had been every year since 2010, with the exception of 2019, when digital communications received most applications. Digital communications remained a close second in 2020 followed by computer technology.
There were declines in filings in some technical fields in 2020 including transport (-5.5%), measurement (-5.2%), other special machines (-2.5%), and organic fine chemistry (-1.5%). The top five technology fields – that that received most applications were medical technology (+2.6%), digital communications (+1%) and computer technology (+1.9%), electrical machinery, apparatus, and energy (+0.4%), and transport (-5.5%).
Technology fields showing growth in 2020
2020 was the year in which applications in pharmaceuticals, biotechnology and medical technology showed most growth among the top 10 fields, in terms of the number of applications received. In pharmaceuticals there was a year-on-year increase of 10.2%, and in biotechnology there was an increase of 6.3% in 2020. While not in the top 10 technology fields, the field of semiconductors also stands out among the 35 fields reported, with a year on year growth of 7.1% in applications received.
MEDICAL TECHNOLOGY
The field of medical technology which includes devices, equipment and tools to detect or prevent disease as well as surgical systems and devices, received 14,295 applications in 2020.
Further, it is noted that of the total 14,295 applications received in medical technology, the majority of applications (10,139) were filed by applicants outside the “top 25” and by applicants who filed fewer than 50 applications. France stands out with an increase, of 17.5% in comparison with 2019, to 677 filings.
In a review of the classification of applications in 2020, the EPO highlighted that the sub-domain of clinical devices including: smart devices and connected health showed particularly strong growth.
In medical technology, US applicants, including:
- Johnson & Johnson,
- Medtronic,
- Boston Scientific,
- Becton Dickinson,
- 3M, and
- Edwards Lifesciences,
filed 38.6% of all filings (5,519) closely followed by European applicants, including:
- Royal Philips,
- Sanofi, and
- Fresenius,
who filed 38.2% (5,460).
DIGITAL COMMUNICATIONS
The field of digital communications includes the inventions used to transmit digital data, transmitters and receivers, smartphones, wireless sensors, and satellites. The EPO reports sustained levels of applications for 5G and the Internet of Things (IoT) including smart connected devices.
It was also reported that the technical field of video codecs (used to encode and compress video data for faster streaming) increased more than 15-fold from 2011 to 2020, with more than 1,000 European patent applications in 2020.
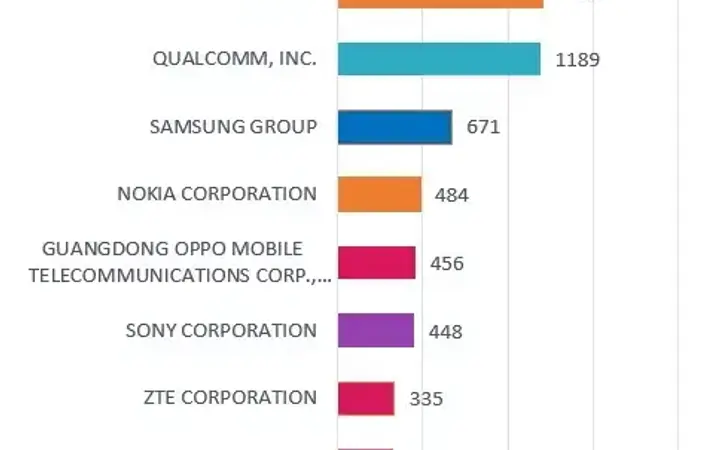
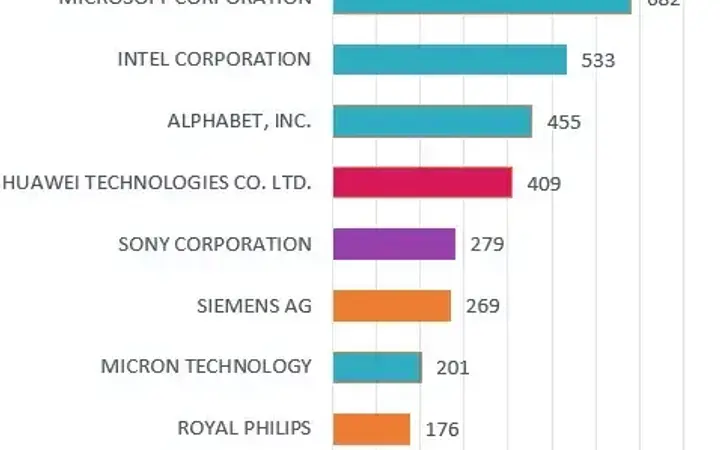
In 2020, Huawei retained top spot for applications filed in the field of digital communications while 26.5% of all applications in this field originated from China.
Within Europe, Sweden was the top country of origin, with Germany (including: applications from Deutsche Telekom and Siemens) in second place, and Finland the third largest country of origin for digital communication, due to an increase in filings from Nokia.
The share of total applications was split almost evenly in four ways between applicants from EPC states, the US, China and other.
Top 10 applicants in Digital Communications 2020
COMPUTER TECHNOLOGY
European patent applications in AI have grown tenfold in the last decade, to over 800 filings in 2020. The first patent applications started arriving at the EPO in 2016 in the new field of quantum computing (CPC Classification: G06N10/00: Quantum computers, i.e. computer systems based on quantum-mechanical phenomena), in 2020 around 100 applications were received which from low levels, represents an increase close to 300%. A search via Espacenet returns fewer than 700 published European patent applications to date in the CPC classification.
The US (37%) is the world’s leading country of origin for patent applications in the field and the application reflects strength in core software technology (e.g. operating systems, databases, cloud computing), core AI (e.g. neural networks, deep learning, rule-based systems), 3D systems and the healthcare sector. The top ten applicants are completed by three Japanese and two European companies. Fujitsu displaces Apple from the top ten,
In Europe, the leading countries of origin were Germany (1093 patent applications), France (606), the UK (458) and the Netherlands (385).
Top 10 applicants in Computing Technology 2020
APPLICANT TYPE
While much of the focus of the statistics is on “top applicants” most applicants are “smaller applicants” – in reality 99% of applicants to the EPO in 2020 filed fewer than fifty patent applications each. The top 1% of applicants were responsible for half of all filings.
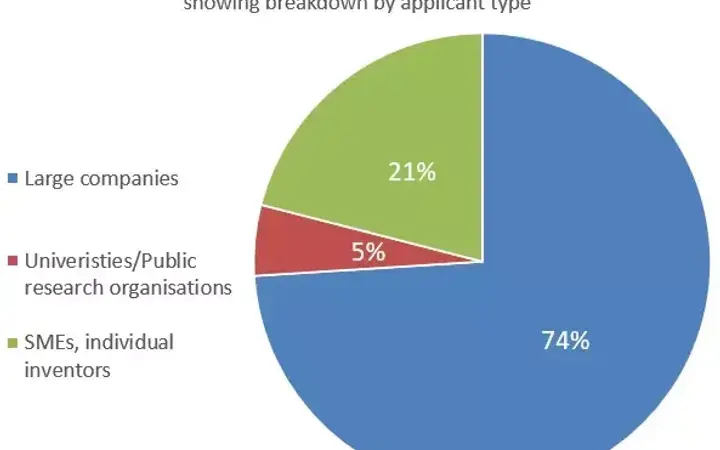
The EPO reports that for applications in all technologies originating from Europe, 74% were filed by large companies and 21 % were filed by SMEs and individual inventors, and 5% by universities and public research organisations.
FURTHER RESOURCES
The above data is drawn from the EPO Patent Index 2020. We note that the EPO has recently launched the new EPO statistics centre which includes some data for 35 fields of technology and country data.
Please contact Catherine Hanratty, Director, Patents, for further information.
